Schools
Is Gov. Brown Right to Dole Out Money to Schools Unequally?
The disparity in per student funding among some San Mateo County schools is considerable.

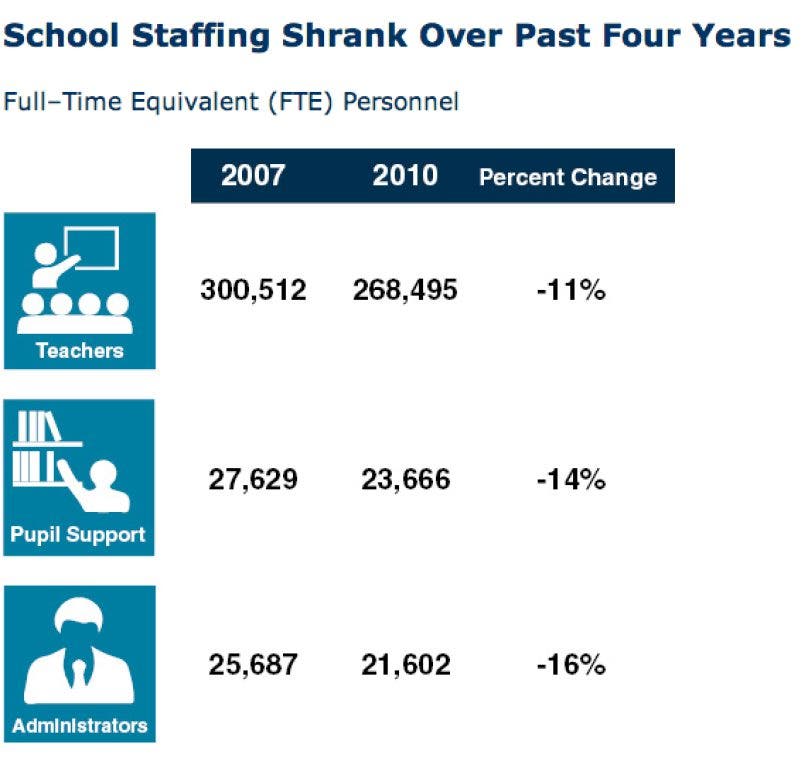
This is what California public education looks like after the Great Recession:
Between 2007 and 2010, the number of teachers in the state's K-12 classrooms shrunk by 11 percent. Reading specialists, librarians, and other school employees helping students learn declined by 14 percent. Front offices took the hardest blow, with the number of administrators dropping by 16 percent. All these cuts hit schools even as the total enrollment held steady at around 6.2 million students.
Find out what's happening in Menlo Park-Athertonwith free, real-time updates from Patch.
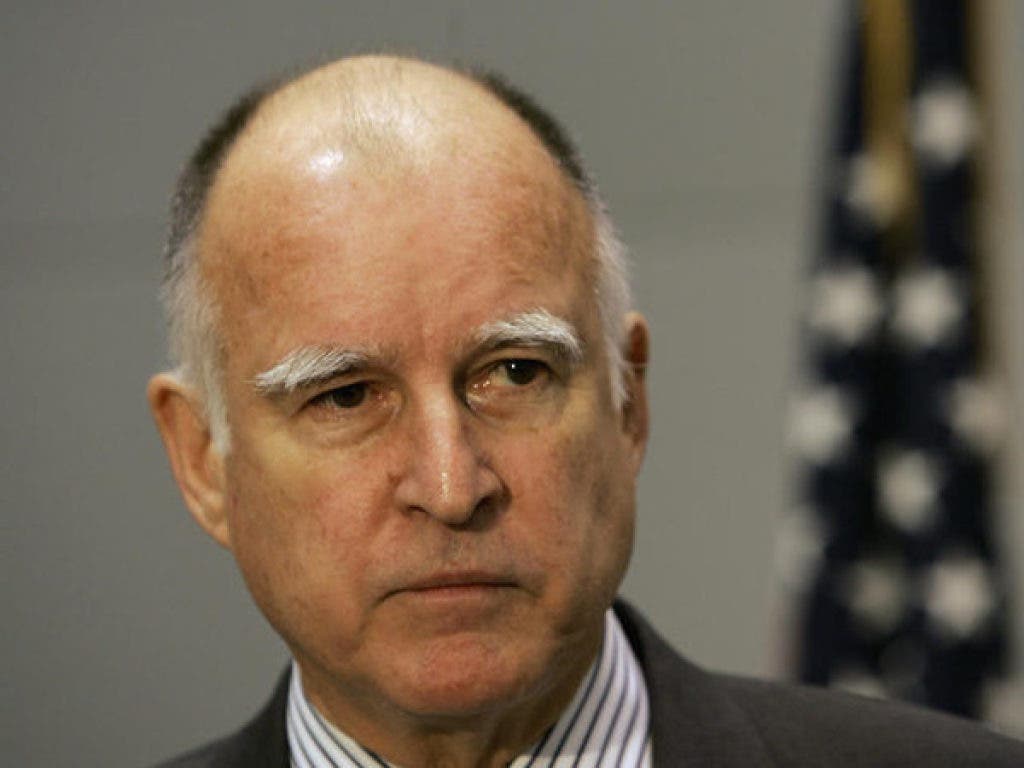
Now that California is looking at its first budget without a deficit in five years, Gov. Jerry Brown's budget calls for restoring some money to the state's public schools. But, he does not want to distribute the money equally.
[For differences in revenues between San Mateo County school districts during the 2010-11 school year, see the tables at the bottom of this article.]
Find out what's happening in Menlo Park-Athertonwith free, real-time updates from Patch.
"Aristotle said, 'Treating unequals equally is not justice.' And people are in different situations. Growing up in Compton or Richmond is not like it is to grow up in Los Gatos or Beverly Hills or Piedmont," Brown said, according to the San Francisco Chronicle.
There are already big differences in the sums school districts get from the state.
Consider two communities Brown mentioned, Piedmont and Richmond. In the 2010-11 school year, Piedmont received $12,287 for every student. The West Contra Costa Unified School District, which includes Richmond, received $9,735 per student.
But only $3,300 of Piedmont’s revenue came from the state. That’s about a third less than the average unified school district gets from Sacramento. Contra Costa Unified School District received $5,600 per student from the state, which is more than the statewide average.
Here’s how Piedmont made up the difference and then some: The $9.1 million that Piedmont raised that school year in parcel taxes was 7,589 percent higher than the statewide average.
Brown’s spending plan has a $3 billion more than last year for K-12 and community colleges, will that be enough to bridge the economic gap that contributes to the achievement gap, and ultimately becomes a cycle-reinforcing income gap? Does more money improve student performance?
Belmont-Redwood Shores Elementary SD Revenue for 2010-11 Source $ Amount per student % Statewide average for elementary school districts State Aid $28 1% Local Property Taxes $6,730 340% Federal Revenue $269 29% Other State Revenue $575 39% Other Local Revenue (includes parcel taxes) $1,685 229% Total $9,286 110%Las Lomitas Elementary School District Revenue for 2010-11
Source $ Amount per student % Statewide average for elementary school districts State Aid $214 0% Local Property Taxes $9,112 461% Federal Revenue $438 47% Other State Revenue $474 32% Other Local Revenue (includes parcel taxes) $3,534 481% Total $13,772 162% Menlo Park City Elementary SD Revenue for 2010-11 Source $ Amount per student % Statewide average for elementary school districts State Aid $221 7% Local Property Taxes $7,801 395% Federal Revenue $329 35% Other State Revenue $621 42% Other Local Revenue (includes parcel taxes) $1,278 174% Total $10,249 121% Redwood City Elementary SD Revenue for 2010-2011 Source $ Amount per student % Statewide average for elementary school district State Aid $2,386 71% Local Property Taxes $3,295 167% Federal Revenue $738 79% Other State Revenue $1,959 132% Other Local Revenue (includes parcel taxes) $599 82% Total $8,977 106% San Carlos Elementary SD Revenue for 2010-11 Source $ Amount per student % Statewide average for elementary school districts State Aid $2,252 75% Local Property Taxes $3,171 160% Federal Revenue $540 58% Other State Revenue $1,078 73% Other Local Revenue (includes parcel taxes) $1,788 243% Total $9,102107%
Sequoia Union High School District Revenue for 2010-11 Source $ Amount per student % Statewide average for high school districts State Aid -$100% Local Property Taxes $10,995 347% Federal Revenue $511 57% Other State Revenue $995 67% Other Local Revenue (includes parcel taxes) $1,119 158% Total $13,570
139%
Source $ Amount per student % Statewide average for elementary school districts State Aid $286 9% Local Property Taxes $11,390 576% Federal Revenue $575 62% Other State Revenue $503 34% Other Local Revenue (includes parcel taxes) $5,521 752% Total $18,275 216%
Source: California Department of Education, Ed-Data
Get more local news delivered straight to your inbox. Sign up for free Patch newsletters and alerts.

